"What's the average salary in the UK?" is one of the most-searched money questions in Britain — and the honest answer is it depends entirely on where you live. The national median for full-time employees is £39,039 gross (ONS, April 2025), up 4.3% on the year before — but the gap between the highest and lowest paying regions is over £15,000 a year.
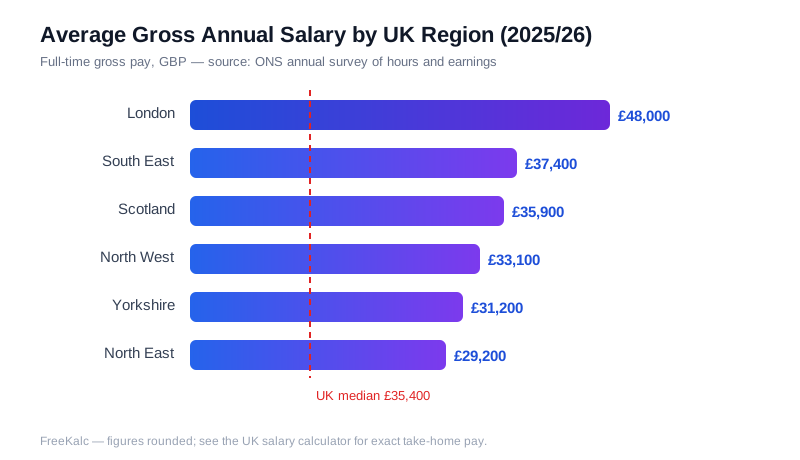
What is the average salary in the UK by region?
These are median gross annual salaries for full-time employees by place of work, from the ONS Annual Survey of Hours and Earnings (April 2025). Take-home pay is estimated for a single worker on the standard English tax code with no pension contributions.
| Region | Median gross | Take-home (single, no pension) | Monthly net |
|---|---|---|---|
| London | £49,692 | £39,298 | £3,274 |
| South East | £39,983 | £32,307 | £2,692 |
| Scotland | £39,719 | £32,117* | £2,676 |
| East of England | £38,597 | £31,309 | £2,609 |
| North West | £37,361 | £30,420 | £2,535 |
| South West | £37,195 | £30,300 | £2,525 |
| West Midlands | £37,064 | £30,206 | £2,517 |
| Northern Ireland | £37,052 | £30,197 | £2,516 |
| Wales | £35,796 | £29,293 | £2,441 |
| Yorkshire & the Humber | £35,682 | £29,211 | £2,434 |
| East Midlands | £35,600 | £29,152 | £2,429 |
| North East | £34,403 | £28,290 | £2,357 |
| UK median | £39,039 | £31,628 | £2,635 |
*Scotland applies its own income tax bands, so actual Scottish take-home pay differs slightly from the estimate shown.
Note how tax compresses the differences: a £15,289 gross gap between London and the North East becomes about £11,008 after tax. Add London's housing costs and the real gap narrows further still.
London's median is 27% above the UK figure and 44% above the North East — but the fastest growth last year was at the other end of the table: Northern Ireland (+8.2%), the North West (+6.2%) and the West Midlands (+6.1%) all outpaced London (+4.7%).
Average UK salary by age group
Full-time median pay climbs steeply through the twenties, peaks in the forties, then eases back. The 18–21 group saw the biggest rise (+7.3%), a direct effect of the National Living Wage increasing 6.7% in April 2025.
| Age group | Median full-time pay | Change on 2024 |
|---|---|---|
| 18–21 | £23,596 | +7.3% |
| 22–29 | £32,347 | +3.8% |
| 30–39 | £40,668 | +4.4% |
| 40–49 | £44,244 | +4.9% |
| 50–59 | £41,866 | +5.2% |
| 60+ | £36,467 | +4.1% |
Where does your salary rank? (percentiles)
The fastest way to read your payslip is against the full-time distribution. Half of all full-time employees earn less than £39,039; half earn more.
| Full-time annual pay (April 2025) | Percentile |
|---|---|
| Up to £23,990 | 10th — lowest-paid tenth earn below this |
| £29,262 | 25th — lower quartile |
| £39,039 | 50th — the median |
| £54,009 | 75th — upper quartile |
| £76,903 | 90th — top tenth earn above this |
So a £30,000 salary sits just above the bottom quarter of full-time earners; £45,000 is comfortably above the median; £55,000 puts you in the top quarter; £77,000 in the top tenth.
What is the difference between median and mean UK salary?
Headline "average salary" figures usually quote the median (the person exactly in the middle), because a small number of very high earners distort the mean. The ONS figures for full-time employees in April 2025:
- Median: £39,039 — the person exactly in the middle
- Mean: £48,512 — pulled up by high earners, up 6.0% on 2024
- All employees (full- and part-time) median: £32,890
The mean is around £9,500 higher than the median — so if a report says the average UK salary is £48,000, it's using the mean. Include part-time workers and the median falls to £32,890, which is why headlines disagree with each other so much.
How do I calculate my take-home pay from my UK salary?
Averages are only interesting compared to your own take-home. Enter your exact salary in the UK salary calculator — or see our worked examples for £30k, £40k and £50k salaries. You can also compare specific salaries like £30,000 after tax or £40,000 after tax.
Frequently asked questions
What is the average full-time salary in the UK?
The UK national median gross salary for full-time employees is £39,039 (ONS Annual Survey of Hours and Earnings, April 2025), up 4.3% on the previous year. Regional medians range from £49,692 in London to £34,403 in the North East, a gap of over £15,000.
How much is the average take-home pay in London compared to the North East?
In London, a median gross salary of £49,692 yields approximately £39,298 in net take-home pay for a single worker with no pension. In the North East, a median gross salary of £34,403 gives around £28,290 in take-home pay, so the after-tax gap is about £11,008.
Why is the mean UK salary higher than the median salary?
Headline average salary statistics usually report the median of £39,039 because a small number of very high earners pull up the mean average. The mean UK full-time salary is £48,512 — roughly £9,500 higher than the median. If a report quotes an average near £48,000, it is using the mean.
What is the average salary and take-home pay in Scotland and the South East?
In the South East of England, the median gross salary is £39,983 with an estimated single take-home pay of £32,307. In Scotland, the median gross salary sits at £39,719; because Scotland applies its own income tax bands, take-home pay differs slightly from the standard English estimate of £32,117.
What is the average UK salary by age?
Median full-time pay is £23,596 at 18–21, £32,347 at 22–29, £40,668 at 30–39, peaks at £44,244 at 40–49, then falls to £41,866 at 50–59 and £36,467 at 60+. All figures are from the ONS ASHE April 2025 release.
What is a good salary in the UK in 2026?
Against the full-time distribution, £54,009 puts you in the top quarter of earners and £76,903 in the top tenth. A salary of £45,000 is comfortably above the national median of £39,039, but whether it feels good depends heavily on your region — median pay in London is £49,692, while in the North East it is £34,403.